
CubeCL recently released a new version that got our matrix multiplication kernels up to the state of the art on a lot of GPUs, but performance on Blackwell was somewhat behind. I fixed this by implementing the kernel based on the Blackwell datacenter kernel from DeepGEMM[1], but modified to work on consumer GPUs. This already provided massive speedups compared to the pre-Blackwell kernels, but I wanted to see how far it can be pushed. As it turns out, not much.
This article requires a basic understanding of the structure of a matrix multiplication kernel. If you need a refresher, check out this article[2] going over our previous kernels.
Basic Architecture Overview
The kernel uses a double buffered producer-consumer model, within the CubeCL-Matmul
framework. Since wgmma/tcgen05[3,4] are not available on consumer cards, and epilogues are currently handled by fusing on write,
I decided to go with a very simple dual-role kernel with a TMA[5] read warp and several MMA[6] compute warps that also handle
storing the output.
The two warp groups use two sets of barriers to communicate:
- Empty barriers mark a stage as "empty" and ready to be written to. Compute warps arrive on these barriers, read warps wait on them before starting a stage load.
- Full barriers mark a stage as fully loaded and ready to be consumed. Read warps arrive on these barriers, compute warps wait on them before starting compute.
This is what makes it producer-consumer: read warps consume empty stages and produce full stages, compute warps consume full stages and produce empty ones. Because we're using multiple buffers, read warps can read stage B while compute warps process stage A, and vice versa. If one of them gets ahead it will wait at the barrier for the other to catch up.
Because of the aforementioned fusion, writers are quite restricted and simply write one MMA tile per warp synchronously. Global partitioning infrastructure exists, but was also unused in this initial implementation.
Attempting to Optimize
I decided to take the easiest and most obvious path: Running Nsight Compute[7]and fixing whatever issues it points out.
Taking some baseline profiling data for the kernel, I noted the profiler hints were primarily about shared memory bank conflicts when storing the output, as well as uncoalesced global writes, and a runtime of 2.88ms.

To fix both the conflicts and uncoalesced writes, I created a prototype writer, using asynchronous TMA write instructions with a full out stage instead of tile-wise writing. This full stage is swizzled to avoid bank conflicts.

Hmm. 2.85ms. That's not a big improvement.
Maybe the lack of impact is because the kernel is not really using the asynchronous nature of TMA. Since I'm not using global partitioning, it exits after writing the tile and no further work is done. So I decided to use them so each kernel processes multiple global tiles in succession, allowing the asynchronous store to overlap with the next iteration.
This immediately caused a deadlock. Turns out, the global partitioning system was never really designed for this kind of scenario, and loading multiple tiles would duplicate all barriers, initialization, etc. So I completely refactored the global partitioning to be driven by the specialized algorithm, rather than calling the specialized algorithm.
After some initial profiling and bug fixing (a for loop in the compute warps somehow increases register use by _60_!), I managed to get it to work as expected. And the result:

2.82ms! A whopping 30µs faster! ... Well, that was a giant waste of time.
Alright, time to take a peek at the competition to see what they're doing. I compiled the same benchmarks using libtorch[8] as a backend, and ran them through the profiler.

It's the same. It's exactly the same. Something is going on here.
So what's happening?
To put it simply, the profiler is lying. Specifically, about this number:

Turns out, that 47% compute throughput is pure fiction. After all my optimizations, the profiler came up with new suggestions, but none of these are relevant, because the truth hides in the warp stall reasons. You just need to know how to interpret them.
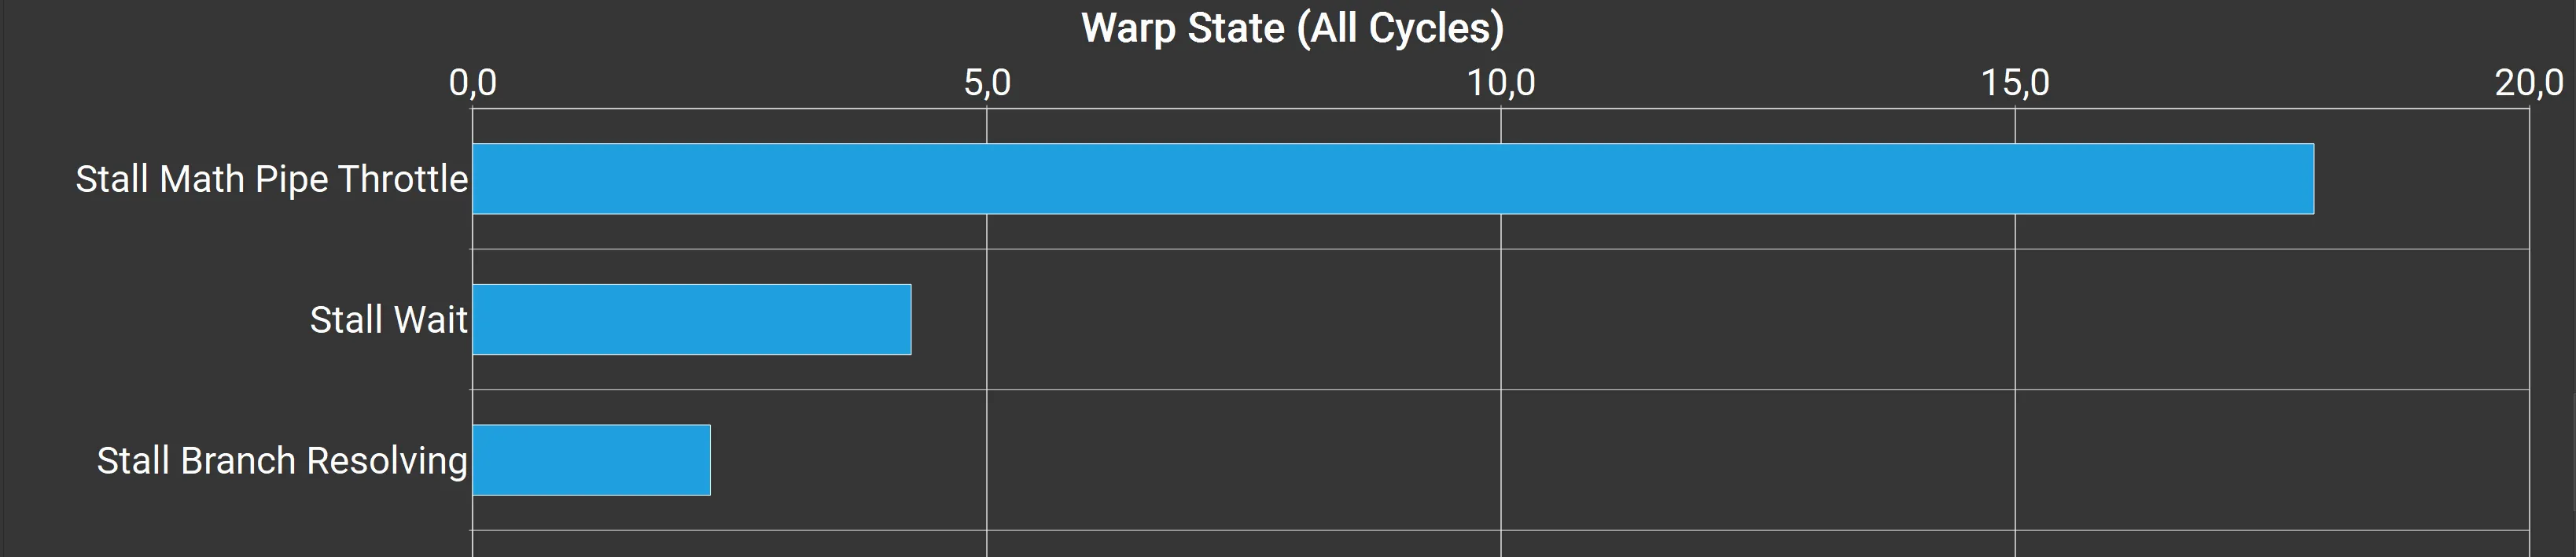
The stall reasons are dominated by 'Math Pipe Throttle', 'Wait' and 'Branch Resolving'. 'Wait' and 'Branch Resolving' are both waiting on a barrier (which is implemented as a spin-lock with a 1µs sleep). Clicking on the source counters reveals these are all in the loading warps, waiting for the shared memory to be freed for the next load. The 'Math Pipe Throttle' stalls are all on the tensor pipeline. What this means is that the loader threads are waiting for compute to finish, and the compute threads are bottlenecked on tensor core throughput.
In other words: We are 100% compute bound. Those tiny improvements were purely from speeding up the tail of the kernel, which makes up a miniscule fraction of the overall runtime.
This explains why libtorch has exactly the same speed. They are also fully saturating the tensor cores.
Just as a final proof, I set the MMA accumulator to f16, which is significantly faster on consumer hardware. As expected, performance immediately jumped ~30%, without any increase to occupancy. This proves that the limitation was compute, since the shared memory and global read/write was already f16.
Note
Because libtorch uses synchronous loads with manual bounds checks and not TMA with hardware accelerated checks, our specialized kernel is still faster for shapes that aren't aligned to the stage size and these don't quite hit 100% compute utilization. However, apart from vecmat, these shapes are rare in machine learning. So the focus here is on aligned shapes.
What did we learn?
Profiling can be misleading, especially in asynchronous architectures like GPUs, which often obscure the actual bottleneck due to how they're implemented. Nsight's suggestions are especially misleading, since even if you could theoretically speed up an operation by the listed percentage, the bottleneck would likely immediately shift elsewhere and the benefit will be fairly small.
If an optimization doesn't have the expected impact, ensure there's no bottleneck elsewhere, before committing even further. Otherwise you might waste a lot of time on optimizations that yield little benefit. Look at profiles holistically, rather than focusing on specific hints like shared memory bank conflicts or uncoalesced loads. In this case the stall reasons always contained a very large percentage of `Math Pipe Throttle`, which could have given a hint that writing might not actually be a bottleneck, even if it's optimal.
If the code seems to stall in a strange location, it might be one of the instructions leading up to that point - Especially if the stall point is at a branch or at the end of a loop/kernel. This is true on CPUs as well due to pipelining, but is especially noticeable on GPUs. Another useful tool for tracking down the real reason for these odd stalls is to look at the register and memory dependencies, if the profiler has tooling for this. Nsight shows them all separately as arrows when looking at the compiled SASS.
Addendum (it can go right)
Just to make this article not entirely negative: We also managed to implement a very successful optimization on AMD. Shared memory loads were very inefficient on that platform, due to being primarily built for NVIDIA. By refactoring loads to always load the maximum number of contiguous elements, rather than individual registers, performance on AMD was significantly improved to the point where the manual loading now often beats the built-in MMA API. We also added support for the Hopper+ stmatrix instruction, which actually had the same improvement as all the optimizations listed in this article with a fraction of the effort. So even if it doesn't always go right, sometimes you'll hit the jackpot.